
| SpaceClaim Online Help |
|
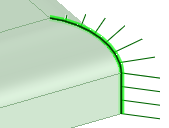
This tool can be used to visualize tangency (or lack of tangency) between two faces. You won't see any data points if you select an edge between two tangent faces. Non-tangent faces will show data points because the angle is more than 0. The larger the angle between the faces, the longer the fringe lines will be at each test point.
You can use the Repair dihedral tool guide to make the faces tangent. You should only use this tool guide if the faces are already close to tangent. Neighboring edges are not modified to be tangent as well, so the results can be unexpected if the faces are not close to tangent.
Select a dihedral edge. You can Ctrl+click to select multiple edges.
Data points show the angle between the faces along the edge. Longer data points are shown for larger angles, or, variable dihedral angles
The Analysis section of the Properties panel displays both minimum and maximum edge dihedral angle values
The following tool guides help step you through the process:
|
|
Use the Repair dihedral tool guide to make the faces along the measured edge tangent. The tool guide will slightly modify the two faces to create an edge whose dihedral angle is close to zero. You should only use this tool guide for faces that are close to tangent. |
The following options are available with the Dihedral analysis tool:
|
Color |
Select a color from the drop-down menu. |
|
Slide the scale or click - or + to decrease or increase the relative size of the fringe graph. |
|
|
Density |
Slide the scale or click - or + to decrease or increase the number of points along the edge where the angle is measured and displayed. |
© Copyright 2015 SpaceClaim Corporation. All rights reserved.
