
| SpaceClaim Online Help |
|
Use this tool to show curvature values along faces or edges. You can use this analysis to identify areas with very tight curves that can be difficult to offset or turn into thin solids.
You can also use the visualization to evaluate curvature continuity along a set of faces or edges. Curvature continuity is when the curvature values change in a smooth, continuous manner. You can see continuous curves because the data points will gradually change length or the transition between face coloring is even and smooth. Sudden changes in the length of the data points or color on a face indicates non-continuous curvature.
Select a line, curve, or edges. Ctrl+click to select multiple lines or edges, or select an object in the Structure tree.
You can change the shading colors in the options panel.
You can change the color, scale, and density of the data points in the options panel.
Tip Select Edges in the selection filter, then box select to select all the edges in your design.
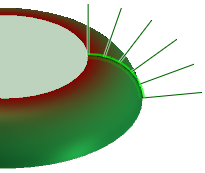
The visualization for edges shows lines at data points along the edge. The greater the curve's radius, the longer the data point. Straight edges won't show any data points because they don't have curvature.
Click ![]() Curvature in the Quality group on the Measure tab.
Curvature in the Quality group on the Measure tab.
Select a face or Ctrl+click to select multiple faces.
You can change the shading colors in the options panel.
In addition to the face curvature display, the absolute values for minimum and maximum curvature are displayed in the Properties panel.
The curvature with the smallest radius is shown in the maximum color (red is the default). The curvature with the smallest radius, or no radius, is shown in the minimum color (gray is the default).
Each line length of the fringe graph represents a curvature value C = absolute value (1/r) when a surface or body is selected.
The following options are available with the Curvature analysis tool:
Show edge curvature using:
|
Color |
Select a color for the fringe graph from the drop-down menu. |
|
Slide the scale or click + or - to increase or decrease the relative size of the fringe graph. |
|
|
Density |
Slide the scale or click + or - to increase or decrease the density of sampling (the number of lines created along the edge). |
|
Shading |
Select Shading to display face curvature using color. Select colors for Min and Max from the drop-down menus. |
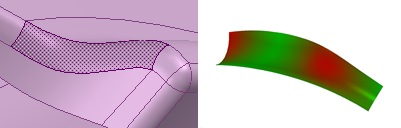
Displaying face curvature using color
© Copyright 2017 SpaceClaim Corporation. All rights reserved.